How To Attach a Debugger to a Running FastAPI Server in VS Code

Introduction
In the realm of software development, debugging is not only inevitable but can also be a complex endeavor.
Picture this: you're faced with the task of deciphering what's occurring within a server that's already humming along. Relaunching it with an attached debugger, the usual go-to method, isn't an option.
In this post, we'll navigate this challenge, zeroing in on how to debug an already running FastAPI server in the rag-stack project as an example. And for those on a tight schedule, here's a quick video tutorial breaking down the process:
Motivation
In a previous project, I wanted to debug the backend server. My initial approach was to examine the startup script to determine the correct way to initiate the backend.
However, the script presented challenges. It was responsible for not just starting the backend but also initiating the frontend and managing numerous configurations. Due to its extensive length and complexity, pinpointing the specific command for the backend server proved difficult.
Given these obstacles, I decided to explore alternative debugging methods, leading to the technique discussed in this post.
Steps
To attach a debugger to a running FastAPI server, follow the steps outlined below:
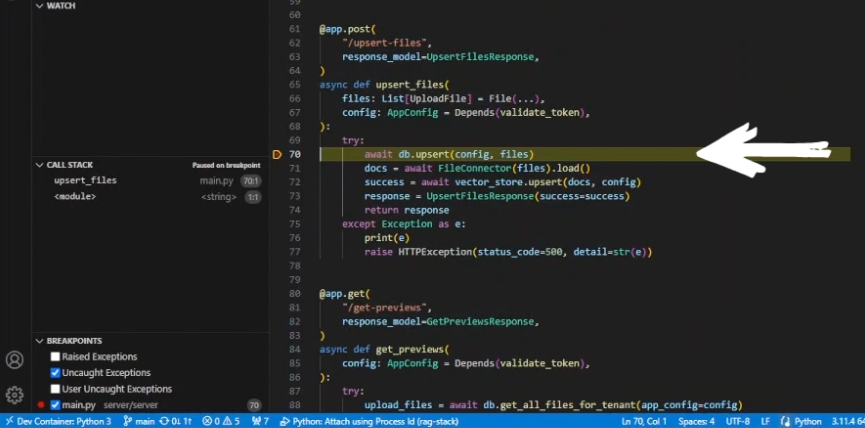
Step 1: Insert a breakpoint
For our example, we will focus on debugging the upsert-files endpoint:
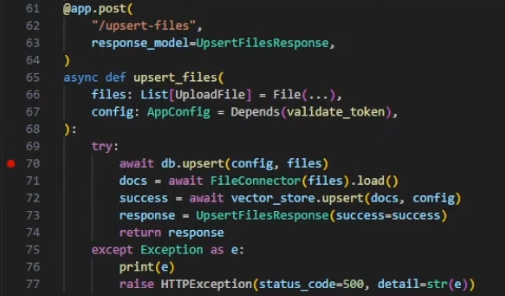
Step 2: Set up a launch configuration in VS Code
In VS Code, open the debug panel and select create a launch.json file:
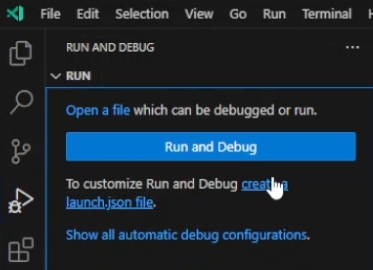
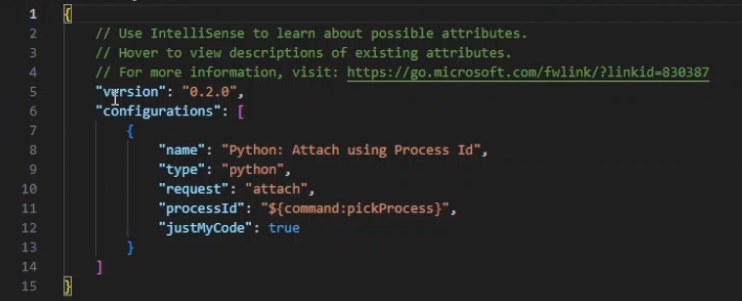
Then, select Python -> Attach using Process ID.
You will end up with a launch.json file that looks like this:
Step 3: Determine the server's process ID
With FastAPI, this is straighforward. By default, FastAPI will print the process ID to the console as part of its startup process:
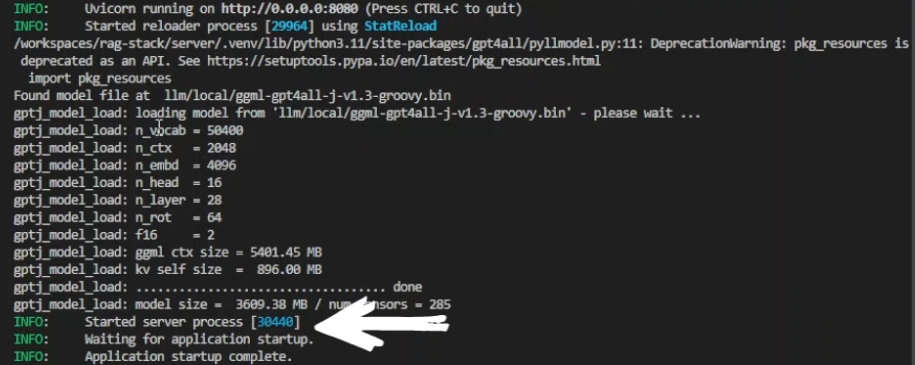
The screenshot above shows the process ID is 30440.
Step 4: Initiate the debugger
With the breakpoint set and the launch configuration in place, we can now initiate the debugger. To do so, select the Debug panel and click the green play button:
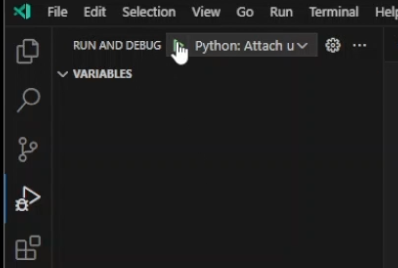
When prompted, enter the process ID:

You need to wait for the debug toolbar to appear before continuing to the next step:

Step 5: Interact with the application
Engage with the application to trigger the endpoint you want to debug, in this case, the upsert-files endpoint:
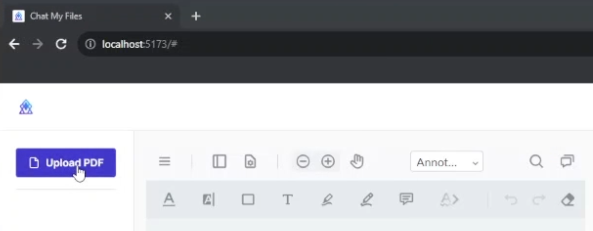
And observe how the execution pauses at the breakpoint, providing you with the opportunity to inspect the application's state!
Caveats
Before diving in, there are a couple of crucial setups to ensure the you can successfully attach the debugger to a running server.
Installing gdb
You need to have gdb installed on your system. To install it on Ubuntu, use the command sudo apt install gdb.
Enabling ptrace
ptrace is a system call in Linux that allows one process to control another, making it essential for debugging.
To enable it on Ubuntu, use the command:
echo 0 | sudo tee /proc/sys/kernel/yama/ptrace_scope
In case you are curious about the possible values ptrace_scope can take:
- If the value is 0, then ptrace is enabled for all processes.
- If the value is 1, then ptrace is only enabled for parent processes that have the same UID as the traced process.
- If the value is 2, then ptrace is disabled for all processes.
If you are working inside a devcontainer, then you need to add the following to your devcontainer.json file:
"runArgs": [
    "--cap-add=SYS_PTRACE"
]
Conclusion
Attaching a debugger to an already running server offers tangible benefits. It enables developers to pinpoint issues in real-time environments without the need for server restarts, ensuring minimal disruption.
This approach is especially beneficial in complex setups where restarting might be cumbersome or detrimental. Having navigated numerous debugging challenges over the years, I believe this is a technique worth adding to any developer's toolbox.
I hope you find this guide useful. If you have any thoughts, questions, or just want to chat about debugging adventures, I'd love to hear from you!
